This post is based on our recent paper: “The influence of anthropogenic aerosol on multi-decadel variations of historical global climate” by Laura Wilcox, Ellie Highwood and Nick Dunstone, which appeared in Environmental Research Letters. One of our main conclusions was:
- Mid-century (1950s-1960s) temperature hiatus, and coincident decrease in precipitation, is likely to have been influenced strongly by anthropogenic aerosol forcing.
Here I describe how we came to this conclusion, and use an analogy with Newton’s laws of motion to describe the competing influences on climate.
Background: An increase in aerosol concentration (the particulates) in the atmosphere generally acts to cool the global climate, as sunlight is reflected back to space – we refer to this as the aerosol direct effect. Aerosols can also change the properties of clouds, making them more reflective, or last longer – this is the “indirect effect”. There have been lots of recent studies linking aerosol changes to changes in important parts of our climate system: e.g. Atlantic temperatures, Sahel rainfall and hurricanes.
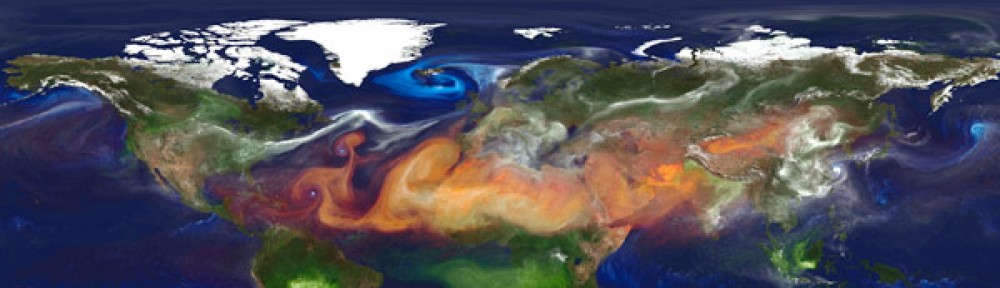
But aerosol has played an important role in the historical changes of global temperature too. Unlike recent greenhouse gas changes, the sign of the influence of aerosols on global mean temperature has varied over time. Whilst greenhouse gas concentrations in the atmosphere have been growing consistently over the past 250 years, aerosol emissions and concentrations have a much more complex history. As aerosols can be washed out by rain, they last for only a few days to weeks if they remain in the lowest part of the troposphere. This means that the pattern globally is very non-uniform (see figure of Aerosol Optical Depth (AOD) below from NASA) and that high concentrations tend to be close to emission regions. Thus if the emissions change over time (e.g. clean air act in Europe reducing aerosol emissions on the grounds of improving air quality since 1960s), this would be seen in the time series of aerosol in the atmosphere too.

The timeseries of aerosol from climate models (we have to do it from models because although we have some idea of the changes in emissions, we have only been able to look at what aerosol is actually in the atmosphere globally for around 20 years) looks like the figure below which is taken from Wilcox, Highwood and Dunstone (2013). Thus there have been times of increase, and times of much smaller change.

What does this mean for the influences on global temperature? Let’s picture the global mean temperature as a floating ball. According to Newton’s laws of motion, this ball will remain stationary unless a net force acts upon it. Now imagine all the possible things that could be pushing the temperature higher (increases in greenhouse gases, decrease in aerosol) as a force on one side of the ball, and all the things that could be pushing the temperature lower (increase in aerosol) on the other side. If “cooling” influences win at any time, then the ball will move towards cooler temperatures. If stronger cooling influences exist, then it will move faster. If cooling and warming influences are more equal, then the ball will stay still, and we would see little trend in global mean temperature. See what we mean in an animation
What did we do?
We used a technique especially developed to deal with noisy timeseries, called Ensemble Empirical Mode Decomposition . This works by decomposing a noisy timeseries into a set of oscillating functions, as shown in figure 2.

We applied this technique to the timeseries of global mean temperature, rainfall, and the hemispheric gradient of temperature. We used simulations that included all things likely to affect climate change (greenhouse gases, anthropogenic aerosols, solar changes, volcanoes), as well as simulations that only included some of these things. We also separated models by the types of aerosol effect that are included.
What did we find out?
Using the different simulations, and imagining that the line in this animation represents the position of the “global temperature ball”, we can show how the influences from aerosol, greenhouse gases and natural forcings changes over time, the arrows in this animation are the forces pushing on the ball.
Because adding up the simulations with single forcings produce the same total temperature time series (by coincidence?), we can put a percentage on the contribution due to each forcing. Aerosol forcing accounts for over 50% of the variability before 1970, and in excess of 70% in the 1940s-1960s.

What’s next?
One of the big uncertainties in the future is how aerosol emissions will change. The climate model simulations we have access to have assumed that aerosol emissions will decrease dramatically by the year 2100. Thus in the global mean aerosol will move from being a cooling push to being a warming push. Thus we will enter a period unlike all others in the recent past, where both greenhouse gases and aerosols are pushing in the same direction. There are enough non-linearities in the climate system to make us think that we might see some new types of changes – particularly in rainfall and circulation patterns. We will look at these competing influences for specific regions, and in the future, using EEMD and other techniques. Should be interesting!
